ROI Calculation Results
Simplista ROI Calculator
ROI Inputs
ROI Calculation Results
Cumulative Monthly Net Benefit
The Simplista ROI Calculator is provided for advisory and informational purposes only. The estimates generated are based on user-supplied inputs and generalized assumptions and do not constitute a guarantee of actual results, savings, or performance.
This calculator is intended to model potential value associated with Item Setup and Item Change processes only. It does not account for benefits, costs, or efficiencies related to other Simplista modules, third-party systems, integrations, organizational change management, or operational variations.
Actual results may vary based on retailer size, data quality, process maturity, system landscape, and implementation approach. Simplista makes no representations or warranties regarding the accuracy or completeness of the calculations. Final ROI should be validated through detailed analysis during solution design and implementation planning.
Simplista
A Business Case to Drive Revenue and Margin
Table of Contents
Why Simplista Matters
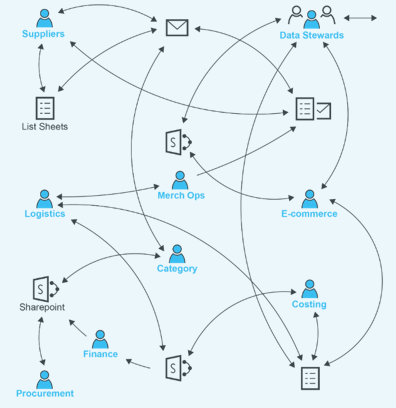
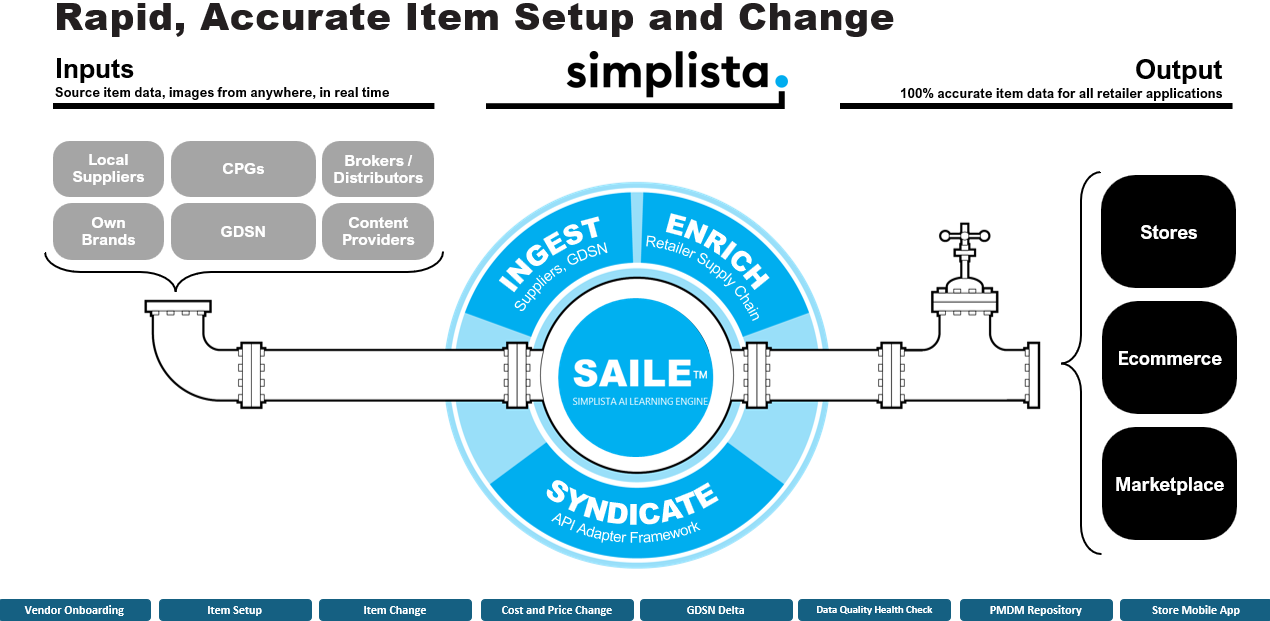
Retailers and suppliers operate in an increasingly complex ecosystem where item data, vendor information, costs, and compliance requirements must move quickly and accurately across systems. Manual processes, disconnected tools, and inconsistent data create delays, errors, and unnecessary operational risk.
Simplista addresses these challenges by providing a structured, workflow-driven platform that standardizes how critical retail data is created, reviewed, approved, and maintained. By acting as a control layer between upstream contributors and downstream systems (such as ERP, PIM, or POS), Simplista helps organizations improve data quality, accelerate time to market, and reduce operational friction—without rebuilding existing systems.
This guide outlines how to build a clear, compelling business case for investing in Simplista.
Note: This business case guide is intended to represent industry best practices based on common retail challenges and proven implementation patterns. The structure, assumptions, and examples provided are advisory and may be adapted or refined to align with your organization’s specific objectives, operating model, and strategic priorities. Simplista supports a flexible approach, allowing each business case to be tailored to reflect unique requirements, timelines, and success metrics.
Step 1: Define What Success Looks Like with Simplista
Start by describing the outcomes your organization wants to achieve. These should be measurable, business-focused, and tied to current pain points. It should also tie back to how Simplista will help grow retail revenue and profitability:
- Increase annual revenue by 15-20%
- Faster time to market = more selling days
- Higher item readiness and availability
- Reduced revenue leakage from errors
- Improved digital shelf performance
- Gain competitive advantage with 40-80x faster item setup and change
- Reduced cycle time for item setup, cost changes, and vendor onboarding
- Fewer delays caused by missing or incorrect data
- Faster approvals through configurable workflows
- Improved Data Quality
- Lower error and rework rates for item, vendor, and cost data
- Standardized validations at the point of entry
- Consistent data flowing into downstream systems
- Reduce costs by 40% through automation and advanced AI
- Eliminate manual coordination via email and spreadsheets
- Clear ownership and accountability at each workflow step
- Reduced effort spent fixing downstream data issues
- Eliminate markdowns and missed promotional windows
- Enforcing data completeness ensures promotional readiness
- Accelerated item setup and cost approvals prevent late arrivals that leads to markdowns
- Validated price and cost audits eliminating errors and forced markdowns
- Guided vendor processes improve execution against promotional timelines
Step 2: Key Considerations and Mitigation Strategies
A strong business case acknowledges potential risks and shows how they will be managed.
Change Management
Risk: Teams may resist moving away from familiar manual processes.
Mitigation: Introduce Simplista incrementally, focus on high-impact use cases first, such as item setup, and provide role-based training. Simplista provides train the trainer knowledge transfer sessions, User Guides and ongoing support through the process.
Integration Complexity
Risk: Concerns about integrating with existing or new ERP or master data systems.
Mitigation: Position Simplista as a complementary workflow and governance layer, not a replacement for systems of record. Simplista is the “Front Door” to your Omnichannel and controls the syndication of clean, approved data out to the appropriate systems through established API’s. Whether your ERP is established or undergoing transformation, Simplista serves as the intelligent mediation layer—governing, transforming, and delivering the right data to the right systems at the right time
Scope Creep
Risk: Attempting to solve too many problems at once.
Mitigation: Clearly define phase one objectives and expand only after measurable success. Simplista’s standard first phase would include Vendor Registration (management of vendor user access to Simplista) and Item Setup.
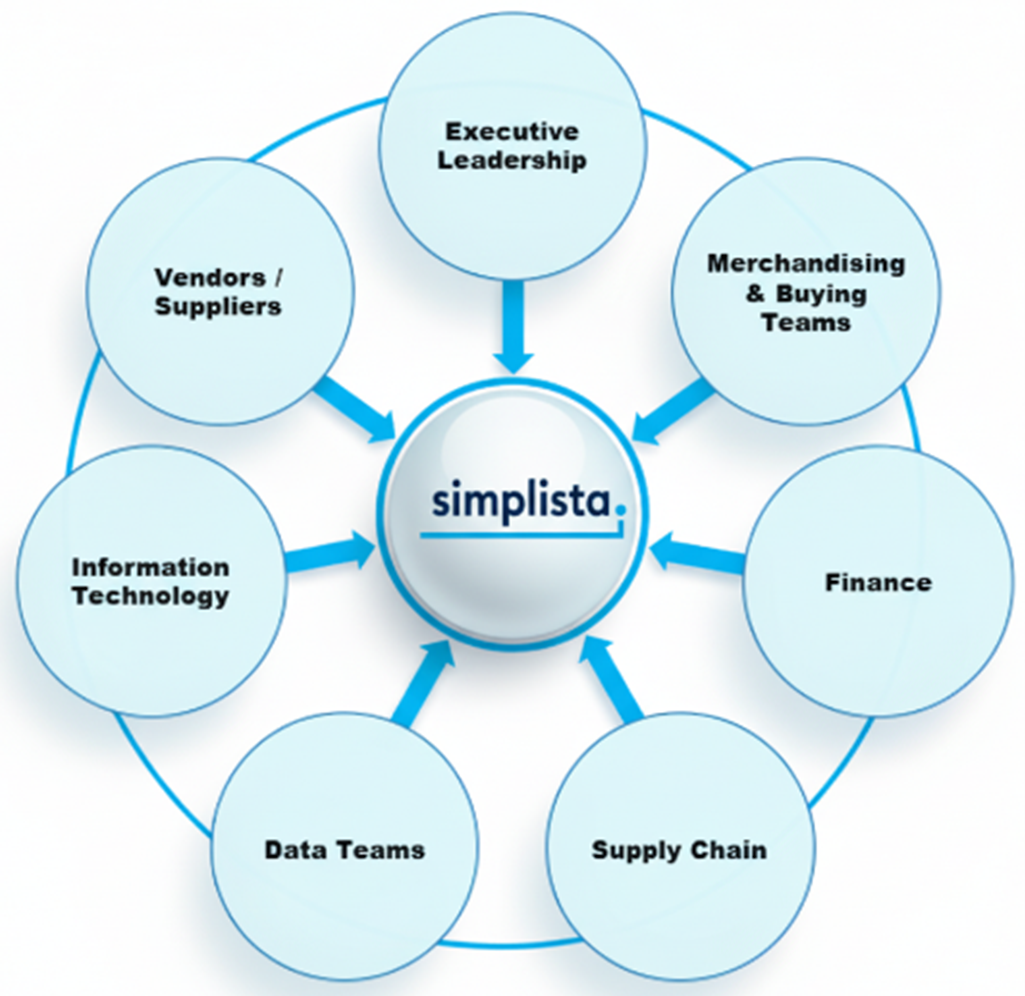
Step 3: Identify Stakeholders and Their Drivers
Different stakeholders care about different outcomes. Align Simplista benefits to what matters most to each group.
Executive Leadership
Drivers: revenue growth, margin protection, speed to value, risk reduction, scalability.
Simplista accelerates time to market, improves execution reliability, and reduces operational risk by ensuring critical data and decisions are complete, validated, and approved before reaching core systems.
Merchandising & Buying Teams
Drivers: faster item launches, promotional readiness, accuracy, ease of collaboration.
Simplista streamlines item setup and change through guided workflows and validations, reducing back-and-forth, improving data completeness, ensuring items are truly sell-ready when they reach stores and digital channels.
Supply Chain
Drivers: On-time availability, predictable inbound flows, inventory accuracy, accurate, fewer downstream corrections.
Simplista ensures item, cost and logistics data is complete and accurate, reducing late arrivals, slotting issues, improving truck load calculations and reducing excess inventory.
Finance
Drivers: Accurate costs, protected margins, fewer downstream corrections, auditability.
Simplista enforces validations and approvals before data reaches financial systems while providing full audit trails and traceability.
Information Technology
Drivers: Stable integrations, security, reduced support burden, scalability.
Simplista acts as a governed control layer that standardizes and validates data before it flows into core systems, reducing integration complexity, downstream incidents, and ongoing IT maintenance.
Data Teams
Drivers: data quality, scalability, governance, compliance, automation.
Simplista improves upstream data quality through validations and standardized workflows, reducing downstream remediation and enabling more reliable analytics, reporting, and AI initiatives.
Vendors / Suppliers
Drivers: Clarity, simplicity, fewer rejections, faster onboarding, transparency.
Simplista provides structured, guided data submission with clear feedback and status visibility, reducing rework and helping vendors meet retailer requirements more efficiently.
Step 4: Communicate Benefits and ROI
Translate Simplista’s capabilities into business value.
Quantifiable Benefits
- Reduced Item Setup and Item Change cycle times
- Fewer data-related defects and corrections
- Lower operational overhead for merchandising and data teams
Qualitative Benefits
- Improved collaboration across internal teams and vendors
- Greater confidence in downstream reporting and analytics
- Stronger governance without slowing the business
- Use real examples such as:
- Items launching faster due to fewer rejections
- Cost changes processed accurately the first time
- Vendors submitting higher-quality data with less support
Step 5: Outline the Implementation Approach
Start Focused
- Identify one or two high-impact use cases (e.g., Item Setup or vendor onboarding)
- Define success metrics upfront
Phase and Scale
- Roll out in manageable phases
- Expand workflows, validations, and data domains over time.
Enable Ownership
- Shift control to business teams through configurable rules and workflows
- Reduce long-term reliance on IT for changes
Simplista is designed to deliver value quickly while supporting long-term growth and adaptability.
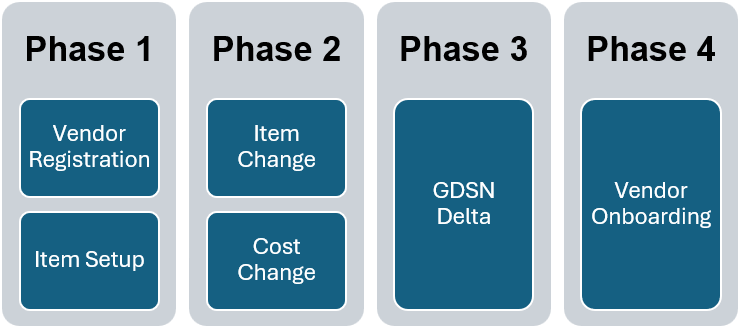
Recommended Phased Implementation Approach: Phase 1: Vendor Registration & Onboarding -> Phase 2: Item Setup -> Phase 3: Item & Cost Change -> Phase 4: GDSN Delta.
Driving Retail Performance with Simplista
Simplista can be a game changer for retailers looking to streamline how critical item, vendor, and cost data is created, governed, and activated across the enterprise. By introducing structured, workflow-driven processes at the point where data is created and changed, Simplista helps organizations improve speed, accuracy, and operational control—without replacing existing systems of record..
With Simplista, retailers ensure that data is complete, validated, and approved before it flows into downstream platforms such as ERP, PIM, POS, and ecommerce systems. This not only reduces errors and rework, but also accelerates time to market, protects margin, and enables teams to execute with confidence. The result is faster launches, fewer markdowns, improved collaboration with vendors, and a stronger foundation for growth.
Realizing these benefits requires more than technology alone—it requires a partner that understands retail operations and execution at scale. Simplista brings deep domain expertise and proven best practices to help retailers navigate complexity, reduce risk, and deliver measurable business outcomes. Our team provides the guidance, tools, and support needed to ensure a smooth implementation and rapid time to value.
Contact Simplista to learn how we can help you modernize retail execution, align teams and partners, and unlock the full potential of your existing systems—driving improved efficiency, stronger margins, and sustainable growth.
Appendix
Why Simplista vs Doing Nothing
Choosing not to address item, vendor, and cost data challenges is still a decision—and often the most expensive one.
The Cost of Inaction:
- Slower time to market: Items, changes, and updates continue to be delayed by manual handoffs, emails, and rework.
- Ongoing data errors: Issues are discovered downstream in ERP, POS, or reporting, where fixes are more costly and disruptive.
- Operational drag: High-value teams spend time chasing information instead of driving growth.
- Limited visibility: Leaders lack insight into where requests are stuck, who owns them, and why delays occur.
Over time, these inefficiencies compound, increasing operational costs, vendor frustration, and risk—while competitors move faster.
Simplista provides a pragmatic path forward by introducing structure, governance, and accountability without requiring a major system overhaul.
Why a Custom-Built Solution Falls Short
Common Challenges with Custom Builds
- High development and maintenance costs: Custom solutions require ongoing IT investment to enhance, support, and adapt as business needs evolve.
- Limited flexibility: Hard-coded rules and workflows are difficult to change without development cycles.
- Inconsistent adoption: Internally built tools often lack the usability and role-based experience needed for broad adoption.
- Technical debt: Over time, custom solutions become brittle, poorly documented, and tightly coupled to specific systems or people.
How Simplista Is Different
- Purpose-built: Designed specifically for retail data workflows like item setup, cost changes, and vendor onboarding.
- Configurable, not custom: Business users can adjust validations, workflows, and rules without code.
- Proven patterns: Based on real-world retail best practices rather than one-off internal assumptions.
- Faster time to value: Deploy in weeks, not months, with immediate operational impact.
Simplista allows IT to focus on strategic platforms while giving the business control over execution.
ROI Calculation Methodology
Time-to-Market Impact:
Accelerating the item setup process allows products to reach sales channels faster. This revenue impact estimates the additional revenue captured during those saved days.
Background
a) ROI calculation estimates 10% of revenue is attributable to new items. Neilsen and IRI studies show new products often generate 8-12% of category sales. For modelling purposes, a conservative estimate of 10% is used.
b) ROI calculation estimates 75% revenue realization factor that directly influences:
- Revenue Opportunity – the maximum revenue you could capture by launching earlier
- Realization Factor – the portion of that opportunity actually captured in practice
c) Indications
- First-mover advantage – successful first movers often capture 30-70% of the available market
- Faster time to revenue – McKinsey study found organizations that accelerate product delivery can capture 2-3x revenue vs their competition that move slower
- Customer Purchase Behavior – Customers who intend to buy do so quickly once options are available.
Error Reduction Savings:
Reducing manual data entry errors minimizes returns, chargebacks, and lost sales. This value reflects a percentage of annual revenue saved through improved data accuracy.
Background
a) Gartner estimates that poor data quality can cost organizations on average ~15% of revenue annually due to lost sales, inefficiencies, and errors. This anchors the idea that a modest 1–2% revenue improvement via error reduction is realistic compared to the total exposure.
b) ROI calculation estimates a total revenue impact of 1.5% with direct impact on the following operational processes.
- Savings Opportunity – the maximum savings you could realize by addressing data quality
- Realization Factor – the portion of that opportunity actually captured in practice
| Process Area | Examples of Errors | Downstream Impact | How It Supports ROI | Rev Impact |
|---|---|---|---|---|
| Item Setup & Maintenance | Incorrect cost, retail, UOM, pack size; missing attributes | Item rework, delayed activation, margin leakage | Fewer corrections and faster item activation reduce operating cost | 0.30% |
| Pricing & Promotions | Price mismatches, incorrect promo dates | SCOP fines, overrides at POS, lost margin | Reduced pricing errors lower SCOP payouts and margin leakage | 0.38% |
| Vendor Data & Costing | Outdated costs, incorrect ship-points | Invoice disputes, manual reconciliation | Fewer invoice exceptions and reduced AP handling costs | 0.23% |
| Dimensions & Logistics | Incorrect weight, cube, case dimensions | Inefficient slotting, freight errors, damage | Accurate data improves logistics efficiency and avoids freight overcharges | 0.15% |
| Compliance & Regulatory | Missing allergens, DINs, WHMIS flags | Fines, delistings, emergency fixes | Avoided compliance incidents and reduced risk-related costs | 0.15% |
| Planogram & Merchandising | Incorrect dimensions or images | Shelf execution failures, rework | Better shelf fit and fewer resets increase sales effectiveness | 0.15% |
| E-commerce & Digital Content | Inaccurate images, dimensions, descriptions | Lower conversion, returns | Improved data accuracy increases conversion and reduces returns | 0.11% |
| Inventory & Replenishment | Incorrect pack/case data, status errors | Overstock/stockouts, inventory shrink | Better data quality improves forecasting and inventory accuracy | 0.05% |
| Total | 1.50% |
Labour Savings:
This figure represents the cost savings achieved by reducing manual effort in item setup and maintenance. It is calculated based on the reduction in hours spent by employees multiplied by their hourly rate.
Background
Gartner and Forrester research cities 30-60% reduction in manual work for item data management when moving from manual spreadsheets/emails to centralized data management tools. ROI calculation uses a conservative 50% reduction in manual effort.